
AgentOps Runbooks for Intelligent Automation: SRE Practices for AI Agents in Business Operations
Summary
A practical, day‑2 reliability guide for operating AI agents in production using SRE disciplines—SLOs and error budgets, telemetry with traces and tool-call metrics, drift detection, canary releases, rollbacks, and incident runbooks. Built for Power Platform and AI agent developers (and SMB ops leaders) deploying intelligent automation on Microsoft Power Platform and Azure, with actionable patterns and templates you can adopt immediately.
Why AgentOps Needs SRE: Day‑2 Reliability for AI‑Driven Operations
AI agents don’t fail like traditional software. They succeed with probabilities, degrade silently, and can be “right” for the wrong reasons. That’s why operating agents in production needs AgentOps: a synthesis of Site Reliability Engineering (SRE) with the realities of generative AI. The central mechanism is the SLO/error budget loop—define the reliability the business needs, measure it, and use error budgets to throttle change and protect outcomes. As the SRE canon puts it, Service Level Objectives specify reliability targets, and error budgets balance innovation with risk; when you overspend the budget, you slow or stop releases until you’re back in bounds. See the Google SRE perspective on objectives and budgets in the Service Level Objectives chapter and implementation guidance in the Site Reliability Workbook.
In AgentOps, the “service” is your agentic workflow—e.g., a customer support triage bot orchestrating Dataverse records, calling external tools, and handing off to humans for edge cases. Day‑2 operations means you’ve shipped v1; now your job is to keep outcomes reliable while you iterate on prompts, policies, and tools. The rest of this guide shows exactly how—on Microsoft Power Platform and Azure—with telemetry, drift checks, safe rollout patterns, incident runbooks, and governance that keep the lights on.
Reference Architecture on Microsoft Power Platform + Azure for AgentOps
Anchor components
– Interaction and orchestration: Power Apps and Power Automate flows coordinate business processes and approvals. Dataverse holds core business data.
– Agent runtime and AI services: Azure OpenAI for language models, Azure AI Content Safety for input/output checks, and Azure Machine Learning managed online endpoints for canarying model/prompt deployments.
– Observability and control plane: Azure Monitor and Application Insights for traces/metrics/logs; Log Analytics for queries/alerts; OpenTelemetry for standardized spans; GitHub/Azure DevOps for CI/CD; Azure App Configuration or feature flags for behavior toggles.
– Security and integration: Azure API Management, Microsoft Entra for identity, and DLP policies in Power Platform environments.
Key integration patterns
– Correlated tracing across Power Platform and Azure. Dataverse and plug-ins can emit telemetry to Application Insights with correlation IDs, tying a Power Automate run to LLM prompts and tool calls. Microsoft documents this integration in Application Insights telemetry for Dataverse.
– GenAI-aware spans. Use OpenTelemetry’s Generative AI semantic conventions for prompt/completion spans, token counts, safety flags, and tool operations, then export to Application Insights. The spec is here: OpenTelemetry Semantic Conventions for Generative AI.
– Azure OpenAI metrics. Requests, latency, errors, usage, and rate limits are available via Azure Monitor, enabling dashboards and SLO-tied alerts. See Azure OpenAI monitoring and diagnostics.
Defining SLIs/SLOs for AI Agents: Task Success, Escalation Rate, Cycle Time, Tool Failure %
Choose SLIs the business understands and your telemetry can measure consistently. Suggested set for most agentic automations:
– Task Success Rate (core outcome SLI)
Definition: percentage of agent-initiated tasks that meet acceptance criteria without human rework within a measurement window.
Formula: successful_tasks / total_tasks.
Target SLO: ≥ 97% over a rolling 4-week window.
– Escalation Rate (cost/control SLI)
Definition: percentage of tasks escalated to a human (manual handling, approval, or intervention).
Formula: escalated_tasks / total_tasks.
Target SLO: ≤ 5% weekly, with separate SLOs by risk tier.
– Cycle Time p95 (experience SLI)
Definition: 95th percentile of end-to-end task completion time (trigger to outcome recorded in Dataverse).
Target SLO: p95 ≤ 2 minutes during business hours.
– Tool Failure %
Definition: percentage of tool-call attempts that return an error or idempotency abort (e.g., HTTP 5xx, timeouts beyond retry budget).
Formula: failed_tool_calls / total_tool_calls.
Target SLO: ≤ 0.5% weekly.
Turn SLOs into a release policy. Use an error budget policy to gate changes: when Task Success dips below SLO or Tool Failure exceeds SLO and the 4‑week error budget is exhausted, automatically pause prompt/model/tool releases, focus on remediation, and only resume after stability returns. This is lifted directly from SRE practice; see Implementing SLOs and the foundational guidance in Service Level Objectives.
Telemetry That Matters: Structured Traces for Prompts, Tool Calls, and Outcomes (OpenTelemetry + App Insights)
Instrument once, analyze forever. Adopt the GenAI semantic schema so every agent span carries consistent attributes. The OpenTelemetry conventions define span kinds and attributes for prompts, completions, token usage, safety filters, and tools; see Generative AI semantic conventions.
Minimum viable trace model
– Root span: business process execution (e.g., flow run). Attributes: business_process, environment, flow_run_id (also stored in customDimensions), user/tenant, risk_tier.
– Child span: llm.prompt. Attributes: model, temperature/top_p, input_tokens, safety_flags, grounding_source, guardrail_decisions.
– Child span: llm.completion. Attributes: output_tokens, finish_reason, safety_blocks, latency_ms.
– Child span: llm.tool. Attributes: tool.name, tool.action, request_idempotency_key, status (ok/error), retries, backoff_ms, http_status, external_latency_ms.
– Terminal event: outcome. Attributes: success=true/false, escalation=true/false, reason_code, cycle_time_ms.
Export everything to Application Insights. Azure OpenAI already publishes metrics/logs into Azure Monitor; combine those with your custom traces for full-fidelity observability. Reference: Azure OpenAI monitoring and diagnostics. And tie Power Platform runs into the same trace using Application Insights for Dataverse; see Dataverse telemetry with Application Insights.
Resiliency basics every tool call should implement
– Retries with exponential backoff for rate limits/timeouts.
– Request timeouts.
– Idempotency keys for side-effecting operations.
– Usage monitoring and alerting.
These are standard production patterns in OpenAI’s guidance; see OpenAI production best practices.
Drift Detection and Guardrails: Prompt, Model, Data, and Business Outcome Drift
Four kinds of drift to watch
– Prompt/policy drift: textual changes that alter agent behavior (often subtle).
– Model drift: model/version swaps or vendor updates that shift outputs.
– Data drift: RAG corpus changes, connector schema tweaks, or freshness gaps.
– Business outcome drift: SLIs degrade even when inputs look stable.
How to detect and block drift
– Offline/online evaluations: Benchmark prompts and policies against a curated dataset with metrics like groundedness, relevance, and similarity. Compare baseline vs. candidate in CI; run online A/B canary checks in production. Azure AI Studio’s Prompt flow supports both; see Evaluate models and prompts.
– Guardrails at ingress: Use Azure AI Content Safety Prompt Shields to detect prompt injection/jailbreak attempts and block or sanitize before inference; see Prompt Shields.
– Safety budgets: Track the rate of safety blocks and attempted injections as a leading indicator. Spikes should trigger investigation and possibly tighter tool scopes.
– Outcome regression alerts: If Task Success or Cycle Time p95 deviates beyond control limits (e.g., 3σ), open an incident—whether or not a change was deployed.
Safe Deployment: Rings, Canary, Shadow Mode, Feature Flags, and Fast Rollbacks
Release like you mean it
– Rings: Internal, pilot (5–10% of traffic or a named business unit), then organization-wide. Advance only when SLOs hold and error budget remains healthy.
– Canary: Split traffic between baseline and candidate and compare SLIs in real time. Azure ML managed online endpoints make this easy by adjusting traffic weights between deployments; see managed online endpoints traffic control.
– Shadow mode: Run the candidate in parallel without affecting outcomes; log deltas.
– Feature flags: Use Azure App Configuration or environment variables to toggle agent tools and behaviors. Keep flags for fast disablement.
– Fast rollback: Keep the previous deployment hot and reduce the candidate’s weight to 0% instantly if SLOs regress.
Quality gates
– Pre-merge: Offline evals in Azure AI Studio must meet or exceed baseline metrics.
– Pre-release: Shadow runs meet drift and safety thresholds.
– During canary: Error budget policy automatically halts rollout if SLIs breach limits, per the release-throttling practices in the SRE Workbook.
Incident Response Runbooks: Detection, Triage, Mitigation, and Human Fallback
Adopt Azure’s well-architected reliability principles—health models, proactive alerts, and automated remediation—then write them down as repeatable runbooks. See the reliability pillar in the Azure Well-Architected Framework.
Standard runbook template
– Detection
Alert rules in Azure Monitor fire on SLI threshold breaches (e.g., Task Success < 95% for 15 minutes), rate-limit storms, or tool failure bursts. Azure OpenAI and Application Insights supply the signals; see Azure OpenAI monitoring.
– Triage
Identify blast radius by environment, workload, and ring. Check recent deployments, token usage spikes, and safety blocks. Use correlated traces (flow_run_id) to locate failing tools.
– Mitigation levers
1) Drop canary weight to zero or toggle feature flags off. 2) Force human-in-the-loop fallback for risk-tiered tasks. 3) Reduce model temperature to stabilize outputs. 4) Temporarily narrow tool permissions. 5) Apply retry/backoff overrides and increase timeouts within safe bounds, aligning with production best practices.
– Human fallback
Route affected tasks to a Teams queue with necessary context for swift manual handling. Log reason_code to enable postmortems.
– Communication
Post incident start/update/resolve messages in the Teams channel, including customer impact, ETA, and next steps.
– Post-incident review
Within 72 hours, run a blameless review: timeline, root cause(s), what detection missed, and actions. Update runbooks and SLO/error budget policy accordingly. See guidance in the Well-Architected reliability pillar.
On-Call and Handoffs: Alerting in Teams, Playbook Format, and Post‑Incident Reviews
– Alert routing: Use Azure Monitor action groups to send messages to a Teams channel via webhook or Logic App. Include quick links to relevant KQL queries and canary controls.
– Playbook format: 1‑page quick start (What broke? Mitigate now), deep procedure, and verification checklist. Store in the repo next to the agent’s prompts/policies.
– Handoffs: Daily 10‑minute reliability standup highlights error budget burn, open incidents, and upcoming changes. Weekly reviews look at trendlines and actions.
– Coverage: Define business-hours vs. 24×7 expectations and on-call rotations proportionate to business criticality.
Human‑in‑the‑Loop Controls: Risk‑Tiered Approvals in Power Automate
Not every decision should be automatic. Implement risk‑tiered approvals directly in Power Automate:
– Tier 0 (low risk): auto-execute; audit only.
– Tier 1 (moderate): capture lightweight approval in Teams for out-of-policy cases or ambiguous confidence.
– Tier 2 (high): always require manager approval; include full context—prompt, retrieved facts, tool plan, and expected side effects.
Wire these branches using Approvals and Dataverse tables that store risk tiers per entity or transaction type. During incidents, a single feature flag can force Tier 1+ to manual until stability returns.
Change Governance: Versioning Prompts, Tools, Policies, and Environment Strategy
Treat prompts like code. Use Git-based versioning with semantic tags (e.g., policy v2.3.1), code reviews, and PR templates that require:
– Diff of prompt/policy changes and intended behavioral shift.
– Offline eval results versus baseline.
– Risk assessment and rollout plan (ring, canary, rollback).
For Power Platform, use managed solutions across Dev/Test/Prod, environment variables for flags/keys, and DLP policies to constrain connectors. Promote via CI/CD only when SLO gates pass and error budgets are healthy.
Dashboards for SMBs: Leading Indicators and Weekly Reliability Reviews
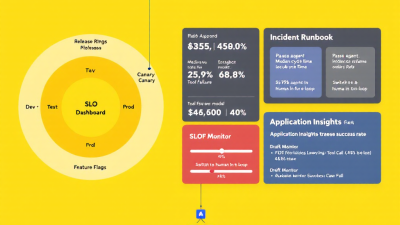
A good SMB dashboard fits on one screen and answers “Are we reliable, and what’s trending?”
– SLO tiles: Task Success, Escalation Rate, Cycle Time p95, Tool Failure % (current vs. target).
– Capacity/health: Requests/minute, token usage, rate-limit hits, safety blocks, injection attempts (from Content Safety), and latency.
– Release watch: Canary vs. baseline deltas for SLIs, canary weight, and error budget burn.
– Cost watch: Avg tokens per successful task; tool retries per task.
Azure OpenAI and Application Insights provide the data; see Azure OpenAI monitoring. Use Log Analytics workbooks to compose views and pin them to a shared Teams tab.
Quick‑Start Assets: KQL Queries, Power Platform Solution Tips, and CI/CD Examples
KQL queries you can paste today
– Task Success Rate (rolling 24h)
traces
| where customDimensions[“event”] == “outcome”
| summarize total = count(), success = countif(tobool(customDimensions[“success”]) == true) by bin(timestamp, 1h)
| extend success_rate = todouble(success) / todouble(total)
– Tool Failure %
traces
| where name == “llm.tool”
| summarize total = count(), failed = countif(tostring(customDimensions[“status”]) == “error”) by bin(timestamp, 1h)
| extend failure_pct = 100.0 * todouble(failed) / todouble(total)
– Cycle Time p95
traces
| where customDimensions[“event”] == “outcome”
| summarize percentiles(tolong(customDimensions[“cycle_time_ms”]), 95) by bin(timestamp, 1h)
– Escalation Rate by risk tier
traces
| where customDimensions[“event”] == “outcome”
| summarize total = count(), escalated = countif(tobool(customDimensions[“escalation”]) == true) by bin(timestamp, 1d), risk = tostring(customDimensions[“risk_tier”])
| extend escalation_rate = todouble(escalated) / todouble(total)
Telemetry tips
– Use OpenTelemetry attributes for prompts, completions, and tools per GenAI conventions.
– Correlate Power Automate runs and Dataverse operations to AI spans using a shared flow_run_id; see Dataverse telemetry to Application Insights.
– Record safety evaluations and Content Safety outcomes as span attributes; see Prompt Shields.
Power Platform solution and environment tips
– Use managed solutions for Prod to prevent hot edits.
– Store prompts/policies as environment-backed configuration records (Dataverse tables) with version metadata and approval workflow.
– Enforce DLP policies to restrict high-risk connectors in lower environments.
CI/CD patterns
– Pull Request gate
Offline eval job in Azure AI Studio must pass baseline thresholds; see Evaluate models and prompts.
– Release gate
Error budget status green for the target service; otherwise, the pipeline pauses per error budget policy.
– Canary stage
Deploy candidate to Azure ML endpoint with 5–10% traffic; adjust weights quickly if SLIs regress; see traffic splitting and rollback.
– Resilience baked in
Implement retries, timeouts, and idempotency for tool calls as recommended in OpenAI production best practices.
Next Steps: Pilot an AgentOps Runbook with B. Cobra Systems
If you’re running agents in production—or are about to—start with one high‑value workflow and stand up the AgentOps basics:
– Define SLIs/SLOs and an error budget policy.
– Instrument traces and tool-call metrics using OpenTelemetry and Application Insights.
– Add drift checks with Azure AI Studio evaluations and Prompt Shields.
– Adopt canary releases with Azure ML managed online endpoints and feature flags.
– Write the incident runbook and wire alerts to Teams.
B. Cobra Systems can help you pilot the full stack on Microsoft Power Platform and Azure, with ready-to-use templates for SLOs, dashboards, KQL, solution structure, and CI/CD. Let’s make your AI agents not just smart—but reliably successful.