
AgentOps Is the New DevOps: Observability and SLAs for AI-Powered Business Process Automation
The Shift to AgentOps: Why DevOps Principles Now Apply to AI Workflow Automation
DevOps gave us a playbook for shipping reliable software quickly. AgentOps is that playbook—updated for autonomous and semi-autonomous AI systems executing real business actions. The difference? AI agents aren’t just code; they’re probabilistic decision-makers that can be brilliant one moment and baffling the next. That volatility demands a new operational discipline: clear success criteria, robust guardrails, end-to-end traceability, and rapid feedback loops that combine telemetry with human judgment.
In production, AI workflow automation touches revenue, compliance, and customer trust. Whether you run flows in Power Automate, orchestrate agents in Copilot Studio, or glue services with n8n/Make/Zapier, the operational surface is the same: distributed tasks, external APIs, LLM calls, and human approvals. AgentOps brings the rigor of SRE—SLIs/SLOs, runbooks, tracing—into this new world so your bots behave like model citizens, not chaos monkeys with company credit cards.
What Reliability Means for AI Agents: From Task Success to Safe Autonomy
Traditional uptime isn’t enough. Reliability for AI agents means predictable business outcomes within policy and budget. It blends:
– Task success: Did the agent accomplish the intended business outcome?
– Safety: Did it respect policies, data boundaries, and role permissions?
– Latency: Did it do so within tolerable time windows for the business process?
– Cost control: Did it stay within token budgets and usage limits?
– Escalation effectiveness: When uncertain, did it escalate to a human quickly and with full context?
– Change resilience: Do prompts, models, and retrieval sources evolve without degrading outcomes?
Treat agents like interns with speed: capable but supervised. Reliability is ensuring they are supervised well, leave an audit trail, and escalate before they improvise.
Defining SLIs/SLOs for AI-Powered Business Process Automation (success rate, escalation rate, latency, cost per task, drift)
Start with common vocabulary. As the Google SRE book on Service Level Objectives defines it: an SLI is a quantitative measure of service performance; an SLO is the target value or range for that SLI. SLAs are contractual commitments derived from SLOs.
Recommended SLIs for AI automations:
– Task success rate: % of runs that complete the intended business outcome without manual rework.
– Escalation rate: % of runs requiring human intervention; track “good escalations” (appropriate caution) vs “avoidable escalations” (prompt/tooling issues).
– Human turnaround time: Mean/percentiles from escalation to decision.
– End-to-end latency: p50/p95 from trigger to outcome posted (e.g., invoice matched, case updated).
– Cost per task: Total tokens x price + downstream API costs per completed task.
– Model/tool failure rate: % of LLM or dependency errors.
– Content/policy violation rate: % of runs blocked by guardrails.
– Drift indicators: Changes in token usage, retrieval hit rate, or success by prompt/model version.
Example SLOs:
– ≥ 97% weekly task success; ≤ 10% avoidable escalations
– p95 latency ≤ 90s for standard cases
– Mean time to approve escalations ≤ 30 minutes during business hours
– Cost per task ≤ $0.15 at p95
– Retrieval hit rate ≥ 92% for knowledge-backed actions
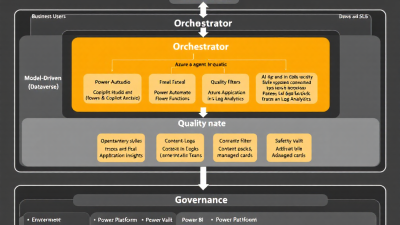
Reference Architecture on Microsoft Power Platform + Azure (Dataverse, Power Automate, Copilot Studio, Azure OpenAI, Functions)
A practical, vendor-neutral reference on Microsoft:
– Event triggers and workflows: Power Automate for orchestration and approvals; Copilot Studio for agentic dialogues and tool-augmented skills; Azure Functions for custom, deterministic actions and resilience policies.
– System-of-record: Dataverse (business entities, exception queues, audit tables).
– Intelligence: Azure OpenAI for models; retrieval layers via vector indexes or structured search.
– Observability: OpenTelemetry SDKs with export to Azure Monitor/Application Insights via OpenTelemetry ingestion; logs and analytics in Log Analytics; business reporting in Power BI.
– Governance: DLP policies and Managed Environments to enforce boundaries and operational hygiene.
Key flows:
– Power Automate triggers an orchestration that calls Functions and Azure OpenAI. Distributed tracing is propagated from the trigger through dependencies using W3C Trace Context in Application Insights distributed tracing.
– Agent prompts, tool calls, and token usage are captured via OpenTelemetry AI semantic attributes, joined with Azure OpenAI platform metrics from Azure OpenAI monitoring.
– Human-in-the-loop is implemented in Power Automate Approvals and surfaced in Teams, using Dataverse to persist decisions and context.
End-to-End Telemetry: Structured Logging, Metrics, and OpenTelemetry Traces for LLM and Tool Calls
To debug agents, you need the movie, not just screenshots. Use traces and spans for every step:
– Instrument LLM calls, tool invocations, and workflow edges with the OpenTelemetry Semantic Conventions for AI, capturing model, operation type, token counts, and outcome.
– Export traces and metrics to Application Insights using OpenTelemetry ingestion for .NET, Node.js, Python, and Java Functions/web APIs.
– Stitch the entire run with distributed tracing so a Power Automate trigger span connects to Function calls, LLM spans, and downstream dependencies.
Baseline telemetry to capture:
– Prompt/response metadata (hashed or redacted), model/deployment, tokens in/out, latency, tool calls and arguments, confidence signals, policy checks, escalation events, final outcome.
– Business dimensions (tenant, product line, region) for SLI slicing.
Traceability and Lineage: Prompt/version control, dataset snapshots, and action audit trails across flows and plugins
When something goes wrong, you’ll be asked: “What exactly did the agent see, decide, and do?” Build lineage by default:
– Prompt lineage: Track prompt template ID and version, parameterized inputs, model/deployment version, and tool/plugin versions using the AI semantic attributes. Azure AI Studio’s Prompt flow can emit step-level traces and export telemetry to Application Insights for this purpose (collect traces and telemetry for prompt flow).
– Data snapshots: For retrieval steps, store hash/version of the knowledge set or document chunk IDs used. Log retrieval hit rates.
– Action audit trails: Persist critical actions and human approvals in Dataverse with immutable records; include trace IDs so auditors can jump from a business record to its technical trace.
Quality and Safety Gates: Policy packs, guardrails, retrieval security, and content filters before actions execute
Create layers of protection before any impactful action:
– DLP and connector boundaries: Use Power Platform Data Loss Prevention policies to segment business vs. consumer connectors, restrict data egress to LLMs, and prevent shadow integrations.
– Managed operations: Govern your estate with Managed Environments for solution management, usage insights, and environment-level guardrails.
– Prompt policies and red-teaming: Maintain a library of reusable guard prompts and test cases (PII handling, role constraints).
– Retrieval security: Validate that sources are authorized; enforce row-level consent and redact sensitive fields before prompt assembly.
– Content filters: Apply pre/post content checks to stop unsafe generations and to require human sign-off for risky intents.
Fallback and Resilience Patterns: Retries, circuit breakers, deterministic backups, RAG failover, and tool sandboxing
Autonomy loves sunny days. Production loves umbrellas:
– Programmatic resilience: Use .NET’s Polly-based policies (retries with jitter, timeouts, circuit breakers, hedging) via Microsoft.Extensions.Resilience around LLM and API calls in Azure Functions and custom actions.
– Quota-aware backoffs: Azure OpenAI enforces per-deployment rate and token limits—plan concurrency and backpressure using guidance in Azure OpenAI quotas and limits, and alert via platform monitoring.
– Deterministic fallbacks: When models fail, route to deterministic regex/heuristics, cached responses, or a summarized “safe mode.” For retrieval outages, degrade to a smaller, local index.
– Cross-tool patterns: Zapier, Make, and n8n each ship pragmatic error handling—use them consistently: Zapier error handling, Make error handlers, and n8n error workflows. Mirror the same “retry-then-fallback-then-escalate” policy set in Power Automate and Functions.
– Sandboxing: Execute tools with least privilege and scoped credentials; validate side effects (dry run → approval → commit).
Human-in-the-Loop by Design: Teams approvals, adaptive cards, and exception queues in Dataverse
Make escalation a first-class path, not a panic button:
– Approvals in Teams: Power Automate’s Start and wait for an approval sends Adaptive Cards to approvers, captures decisions and comments, and persists an auditable outcome—perfect for high-risk actions (refunds, pricing changes, vendor onboarding).
– Orchestrated waits: In custom orchestrations, use the Durable Functions human interaction pattern to pause long-running processes and wait for external approval events with timeouts and reminders.
– Exception queues: Store exceptions and pending approvals in Dataverse with enriched context (inputs, rationale, links to traces). Track SLIs such as “mean time to decision” and “approval timeout fallback rate.”
Incident Response for Agents: Runbooks, on-call alerts, and root-cause analysis with Application Insights and Kusto
Treat agents like production services:
– Alerting: Instrument SLIs and set alerts on p95 latency, failure burst rates, escalation backlogs, and quota/throttling signals from Azure OpenAI monitoring.
– Live diagnostics: Use Application Insights distributed tracing and live metrics to see current health and dependency latency.
– Root cause analysis: Consolidate logs/metrics/traces in Log Analytics and analyze via Kusto Query Language (KQL). Join business records (Dataverse IDs) to trace IDs, correlate prompt versions with error spikes, and quantify impact on SLOs.
– Runbooks: Document “if-this-then-that” manuals: clear cache and rehydrate index; switch model deployment; open a manual processing lane; notify compliance; trigger canary rollback.
Testing and Evaluation: Offline evals, canary and shadow deployments, A/B tests, and regression suites for prompts/tools
You can’t QA a model like a DLL, but you can systematize quality:
– Offline evals: Maintain labeled test sets; run prompts/tools offline with trace capture (Azure AI Studio’s prompt flow supports trace collection) and score accuracy, safety, and cost.
– Canary and shadow runs: Send a small slice of traffic to a new prompt/model while shadowing against the old. Compare success rate, latency, and cost before promotion.
– A/B experiments: Test agent strategies (e.g., multi-step reasoning vs. direct answer) with guardrails on cost per task and escalation rates.
– Regression suites: Snapshot prompts, tools, and retrieval corpora. On changes, run regressions and fail the build if SLIs regress beyond SLO budgets.
Cost and Performance Governance: Token budgets, capacity planning, rate limits, and Power Platform cost controls
– Token budgets: Track tokens per step and per run using OpenTelemetry AI attributes and dashboards in Application Insights/Power BI. Azure OpenAI exposes usage and latency metrics you can aggregate for p95 cost per task (monitoring).
– Capacity planning: Align concurrency to quotas and limits; implement backpressure, queued workloads, and hedging to alternate deployments/regions during bursts.
– Rate limits and backoffs: Enforce client-side throttles; surface “budget exhausted” events to the agent so it can choose a cheaper plan (smaller context, summarized retrieval).
– Power Platform controls: Use environment strategies and DLP to keep costly connectors separate, and Managed Environments for insights and guardrails on solution sprawl.
Security and Compliance: DLP policies, environment strategy, Managed Identity, Key Vault, and audit logging
– Data boundaries: Segment environments (Dev/Test/Prod) and apply DLP policies to control which data can flow to LLMs and external connectors. Use premium connectors only where justified.
– Operational governance: Standardize deployment, monitoring, and solution hygiene with Managed Environments.
– Identity and secrets: Use Managed Identity from Functions and Power Platform custom connectors to call downstream services; store secrets in Key Vault; avoid embedding credentials in flows or prompts.
– Audit logging: Persist decisions, approvals, and high-impact actions in Dataverse with trace IDs; retain logs in Log Analytics per policy.
Comparing Tooling Approaches: Power Automate, Copilot Studio extensions vs. n8n/Make/Zapier for observability and governance
– Power Automate + Copilot Studio: Deep Microsoft 365/Dataverse integration, native Approvals and Teams experiences, strong governance via DLP/Managed Environments, and first-class Azure observability through OpenTelemetry → Application Insights. Best when you need enterprise controls and M365 data gravity.
– Azure Functions add-ons: Ideal for deterministic tools, resilience policies, and custom telemetry. OpenTelemetry and distributed tracing make Functions a reliable “agent backbone.”
– n8n/Make/Zapier: Fast to start and broad connector coverage with built-in error handling: n8n error workflows, Make error handlers, Zapier auto-replay. However, teams often add an observability sidecar (Functions/API) to standardize OpenTelemetry and enforce enterprise policy.
AgentOps Maturity Model: Crawl–Walk–Run stages with milestones and anti-patterns to avoid
– Crawl
– Milestones: Basic SLIs (success, latency, cost), Approvals for risky actions, centralized logs, manual runbooks, DLP in place.
– Anti-patterns: No trace context; prompts edited in production; no clear cost ceiling.
– Walk
– Milestones: OpenTelemetry traces for LLM/tool calls, Application Insights dashboards, circuit breakers and retries, exception queues in Dataverse, canary releases for prompts/models, Power BI SLO dashboards.
– Anti-patterns: Human approvals without timeouts/ownership; silent token explosions; “shadow” connectors bypassing DLP.
– Run
– Milestones: Policy packs and automated quality gates, active-active model or region failover, hedged requests, automated RCA with KQL, monthly SLO reviews tied to business KPIs, budget-aware planning agents.
– Anti-patterns: Over-autonomy with no escalation; uncontrolled tool sprawl; untested retrieval updates.
Quick Start for SMBs and Dev Teams: A 30–60–90 day rollout plan and a downloadable SLI/SLO dashboard template
Days 0–30: Instrument and govern
– Pick one high-value workflow. Define SLIs/SLOs using the SRE SLI/SLO framework.
– Implement DLP and environment strategy; move secrets to Key Vault; switch service calls to Managed Identity.
– Add OpenTelemetry to Functions/custom actions and export to Application Insights. Capture AI semantic attributes for model, tokens, and outcomes.
– Add Power Automate Approvals for any action with financial/compliance risk.
Days 31–60: Build control loops
– Create a Power BI dashboard fed by Log Analytics showing success rate, p95 latency, cost per task, escalation rate, and human turnaround time.
– Add retries, timeouts, and circuit breakers via .NET resilience policies. Alert on quota/throttling per Azure OpenAI monitoring.
– Stand up exception queues in Dataverse with ownership SLAs. Start canary releases for prompt changes.
Days 61–90: Scale and standardize
– Introduce shadow deployments and A/B tests for models/tools; establish a weekly SLO review.
– Add Prompt flow or equivalent to capture full prompt lineage with trace export.
– Publish runbooks for top incidents and automate RCA queries in Kusto. Expand to a second workflow using the same policy packs and telemetry conventions.
What you’ll get right away
– A consistent SLI/SLO vocabulary, a working governance baseline, and a live observability pipeline that makes agent behavior inspectable and improvable.
– An SLI/SLO dashboard template: success rate, p95 latency, escalation rate, cost per task, token usage, quota events, and approval turnaround—ready to wire to Application Insights/Log Analytics and Power BI.
Closing thought
AgentOps isn’t optional; it’s how you turn clever demos into reliable, compliant, and cost-effective business automations. With OpenTelemetry traces, SLOs grounded in SRE best practices, and Microsoft-first governance and observability, your agents can move fast, stay safe, and make the business better week after week.